NFINDR and ATGP
The data folder located at the project download site contains a hyperspectral cube that I use mainly to debug the code. It represents a farm with a few buildings, an access road and a crop field surrounded by trees and water. To build the example I first extracted six endmembers with ATGP. One of the six endmembers caracterize with precision the “white roof” building. The figure 1 is the abundance map generated with this endmember using NNLS. If we copy this endmember in a library and use it with a detection algorithm, we get the result that we see at the figure 2. In this case, the ACE algorithm was used. The white roof building has a characteristic signal that is captured by the endmembers extraction algorithm.
A good test is to run NFINDR on the same data and use ATGP to create the initial working set. After the run, the abundance maps are created with NNLS. We keep the map of the most characteristic endmember associated to the white roof building. This map is what we find at the figure 3. By visual inspection we can see that using NFINDR give a better estimate for the endmember we are looking for.
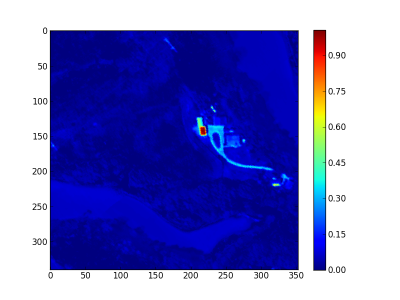
Figure 1: the abundance map for the endmember associated to the white roof building, ATGP is used here.
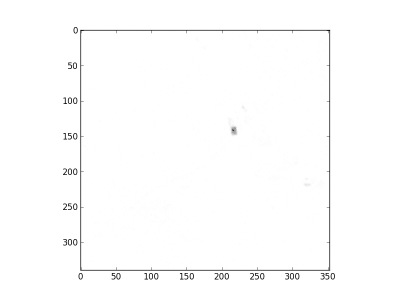
Figure 2: the detection map for the endmember associated to the white roof building (the black spot).

Figure 3: the abundance map for the endmember associated to the white roof building, NFINDR is used here.